This page was generated on 2016.07.12 by Auto-Redistrict.
vtd_data.txt (tab-delimited)
vtd_data.dbf (dbase/ESRI)

Aiken County
Berkeley County
Calhoun County
Charleston County
Dorchester County
Florence County
Georgetown County
Laurens County
Lee County
Orangeburg County
Richland County
Sumter County
VTD district assignments
vtd_data.txt (tab-delimited)
vtd_data.dbf (dbase/ESRI)
Maps (click to enlarge)
| Districts |  Labeled districts Labeled districts |
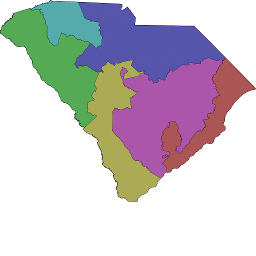 Unlabeled districts Unlabeled districts |
||
| Geometry |  Population difference Population difference |
 Compactness Compactness |
 Splits Splits |
|
| Fairness - by district | 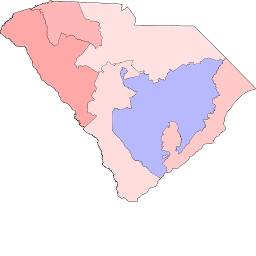 Partisan vote packing Partisan vote packing |
 Racial vote packing Racial vote packing |
 District vote balance District vote balance |
 District demographics District demographics |
Fairness - by density |  Partisan vote packing Partisan vote packing |
 Racial vote packing Racial vote packing |
 District vote balance District vote balance |
 District demographics District demographics |
| VTDs | 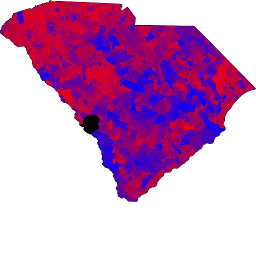 VTD vote balance VTD vote balance |
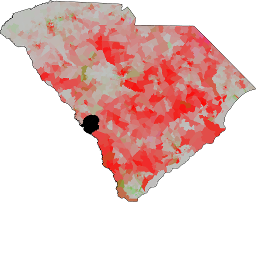 VTD demographics VTD demographics |
 VTD vote balance VTD vote balance(density) |
 VTD demographics VTD demographics(density) |
Seats / votes curve - Vote packing


Summary
| Value | Measure |
|---|---|
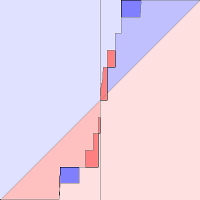
| 0.1968041333480058 | Compactness (isoperimetric quotient) |
| 2,253 | Disconnected population (count) |
| 25.424085514 | Population max deviation (%) |
| 5.792019828 | Population mean deviation (%) |
| 12 | County splits |
| 0.032834580 | Seats / vote asymmetry |
| 9,537.692996404 | Packing/cracking asymmetry (%) |
| 422,696 | Competitiveness (victory margin) |
| 0.178366584 | Disproporionality |
| 0.005636336 | Racial vote dilution |
| 20.676382148 | Efficiency gap (pct) |
| 1.240582929 | Adj. efficiency gap (seats) |
| 700,998 | Undescribed voters |
| 1.0 | FV Safe D |
| 0.0 | FV Lean D |
| 0.0 | FV Tossup |
| 2.0 | FV Lean R |
| 3.0 | FV Safe R |
| 0.673794700 | Mutation rate (%) |
| 33.000000000 | Elitism (%) |
| 0 | Generation (count) |
By party
| Party | Delegates | Pop. vote | Wasted votes | % del | % pop vote |
|---|---|---|---|---|---|
| PRES12_D50 | 1 | 801,921 | 660002 | 0.16666666666666666 | 0.42936928968255667 |
| PRES12_R50 | 5 | 1,065,751 | 273836 | 0.8333333333333334 | 0.5706307103174433 |
By district
| District | Population | Winner | PVI | Vote gap | Wasted votes | FV Safe D | FV Lean D | FV Tossup | FV Lean R | FV Safe R | Pop per seats | Compactness | Area | Paired edge length | Unpaired edge length | PRES12_D50 vote % | PRES12_R50 vote % | PRES12_D50 votes | PRES12_R50 votes | VAP_WHITE % | VAP_BLACK % | VAP_HISPAN % | VAP_ASIAN % | VAP_HAWAII % | VAP_INDIAN % | VAP_MULTI % | VAP_OTHER % | VAP_WHITE pop | VAP_BLACK pop | VAP_HISPAN pop | VAP_ASIAN pop | VAP_HAWAII pop | VAP_INDIAN pop | VAP_MULTI pop | VAP_OTHER pop |
|---|---|---|---|---|---|---|---|---|---|---|---|---|---|---|---|---|---|---|---|---|---|---|---|---|---|---|---|---|---|---|---|---|---|---|---|
| 1 | 858,198 | 0,1, | R+11 | 76772 | 179415 | 0.0 | 0.0 | 0.0 | 0.0 | 1.0 | 858,198 | 0.1476726845600927 | 7.185325810888713E11 | 5679773.88314378 | 2852946.44827266 | 0.3930245520162751 | 0.6069754479837249 | 141,029 | 217,801 | 0.735702056 | 0.182675441 | 0.049649395 | 0.015691450 | 0.000750493 | 0.003557727 | 0.010491925 | 0.001481513 | 491,126 | 121,947 | 33,144 | 10,475 | 501 | 2,375 | 7,004 | 989 |
| 2 | 817,541 | 0,1, | R+7 | 47945 | 169817 | 0.0 | 0.0 | 0.0 | 1.0 | 0.0 | 817,541 | 0.15587071971470917 | 1.0847539183468092E12 | 6970391.317829412 | 3175012.4697443526 | 0.4294164583535758 | 0.5705835416464242 | 145,844 | 193,789 | 0.656563231 | 0.252989253 | 0.059871498 | 0.016141166 | 0.000646671 | 0.003055681 | 0.009938566 | 0.000793933 | 410,180 | 158,052 | 37,404 | 10,084 | 404 | 1,909 | 6,209 | 496 |
| 3 | 724,758 | 0,1, | R+17 | 94153 | 137736 | 0.0 | 0.0 | 0.0 | 0.0 | 1.0 | 724,758 | 0.2558778397340357 | 1.1750203567181736E12 | 4785820.431476198 | 3747520.2228538166 | 0.32910542307538726 | 0.6708945769246127 | 90,659 | 184,812 | 0.762602043 | 0.184812754 | 0.033826770 | 0.008207927 | 0.000201149 | 0.002420902 | 0.007417574 | 0.000510882 | 428,410 | 103,823 | 19,003 | 4,611 | 113 | 1,360 | 4,167 | 287 |
| 4 | 770,395 | 0,1, | R+14 | 88575 | 153249 | 0.0 | 0.0 | 0.0 | 0.0 | 1.0 | 770,395 | 0.2938745852797067 | 4.623421154900824E11 | 3677747.3528711307 | 1024830.8251189603 | 0.35550429531121025 | 0.6444957046887898 | 108,961 | 197,536 | 0.726687541 | 0.185252024 | 0.058942891 | 0.018025800 | 0.000371896 | 0.002047997 | 0.007856082 | 0.000815771 | 424,020 | 108,094 | 34,393 | 10,518 | 217 | 1,195 | 4,584 | 476 |
| 5 | 770,235 | 0,1, | R+6 | 35818 | 151701 | 0.0 | 0.0 | 0.0 | 1.0 | 0.0 | 770,235 | 0.28496358288823853 | 1.5281911904211504E12 | 6014411.215498898 | 2926341.195712771 | 0.4409727028826442 | 0.5590272971173559 | 133,792 | 169,610 | 0.653713570 | 0.292649883 | 0.030366019 | 0.008214746 | 0.000268209 | 0.006510934 | 0.007688644 | 0.000587996 | 380,224 | 170,216 | 17,662 | 4,778 | 156 | 3,787 | 4,472 | 342 |
| 6 | 684,237 | 1,0, | D+14 | 79433 | 141920 | 1.0 | 0.0 | 0.0 | 0.0 | 0.0 | 684,237 | 0.15432787002717774 | 1.7618957203225752E12 | 1.1861471844206866E7 | 154949.5423484664 | 0.6399261553204457 | 0.3600738446795543 | 181,636 | 102,203 | 0.440963470 | 0.515063261 | 0.023911749 | 0.008046675 | 0.000325291 | 0.003779845 | 0.007462672 | 0.000447037 | 231,807 | 270,760 | 12,570 | 4,230 | 171 | 1,987 | 3,923 | 235 |
By ethnicity
| Ethnicity | Population | Vote dilution | % Wasted votes | Victory margins | Votes | Straight vote descr. rep. | Target seats | Votes for next seat |
|---|---|---|---|---|---|---|---|---|
| VAP_WHITE | 2,365,767 | 1.004215909 | 0.227276550 | 282,569.625419543 | 1,243,285.442297753 | 5 | 4 | 15,287 |
| VAP_BLACK | 932,892 | 0.995722653 | 0.225354335 | 111,358.455377943 | 494,148.271664104 | 1 | 2 | 235,653 |
| VAP_HISPAN | 154,176 | 0.979513718 | 0.221685891 | 18,075.012833250 | 81,534.340239863 | 0 | 0 | 469,009 |
| VAP_ASIAN | 44,696 | 0.985674798 | 0.223080281 | 5,281.395625789 | 23,674.865407458 | 0 | 0 | 495,895 |
| VAP_HAWAII | 1,562 | 0.934358198 | 0.211466185 | 175.946443646 | 832.031104742 | 0 | 0 | 505,912 |
| VAP_INDIAN | 12,613 | 0.904245977 | 0.204651115 | 1,362.428016865 | 6,657.320269791 | 0 | 0 | 502,626 |
| VAP_MULTI | 30,359 | 0.976215672 | 0.220939469 | 3,544.404176246 | 16,042.421905701 | 0 | 0 | 499,409 |
| VAP_OTHER | 2,825 | 0.970071411 | 0.219548885 | 328.732106718 | 1,497.307110588 | 0 | 0 | 505,424 |
| TOTAL | 3,544,890 | 1 | 0.226322395 | 1,867,672.000000000 | 422,696.000000000 |
Splits
Aiken County
Berkeley County
Calhoun County
Charleston County
Dorchester County
Florence County
Georgetown County
Laurens County
Lee County
Orangeburg County
Richland County
Sumter County